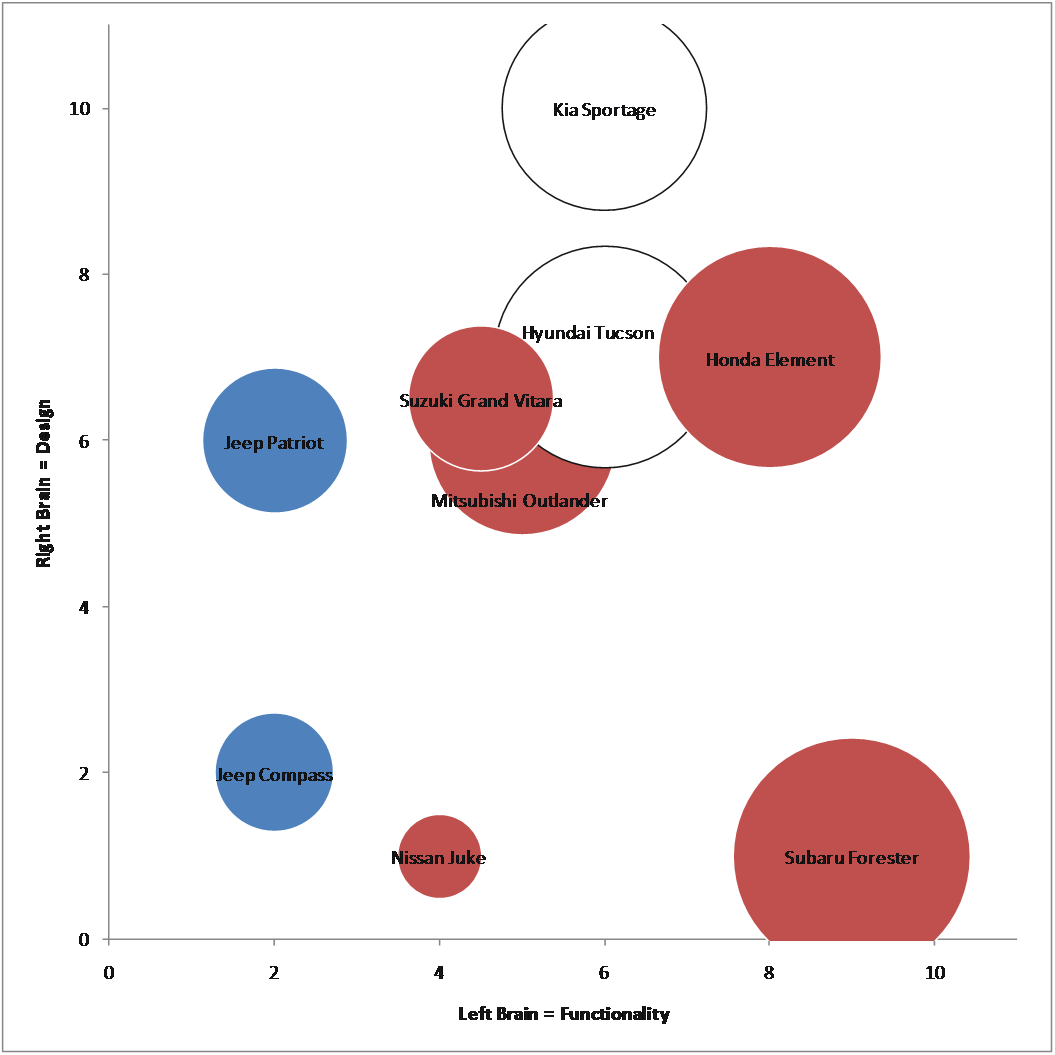
How to interpret the graphs
1) Horizontal X-Axis: "Left Brain"
- Feature functionality
- Driveability (engine, performance, braking, etc.)
- Technology
- Practicality / amount of space
- Reliability / build quality
- Fuel economy
- Exterior design
- Interior design
- Brand cachet
- "Impress the ladies factor" (Is it cool?)
- I subjectively rated each vehicle on a scale of 1-10 based on how ubiquitous the cars are on the road. A Toyota Camry would receive a 10, whereas an Aston Martin Rapide would receive a 1. This is subjective and not based on real sales data.
- Blue=USA
- Red=Japan
- Yellow=Germany
- White=South Korea
- Green=UK
- Black=Sweden
Compact SUVs (sub-$20k)
Small SUVs ($20-25k)

Midsize SUVs ($25-30k)

Entry Luxury SUVs ($30-40k)

Midsize Luxury SUVs ($40-50k)

Large / Performance SUVs ($50k+)
